Partner report Financial overview
The partner report financial overview section comes with 5 different financial overview tables. For further details please look into each of the tables descriptions below.
General purpose
The financial overview tables show how the partner organisation is proceeding in terms of spending. The amounts included in the tables represent the aggregation of data from all partner reports submitted, by the date when the current partner report was created.
Beware that only the last partner report, created after all other partner reports have been submitted, has the most recent aggregated data (in case partner reports were not submitted in the same order they were created)!
All amounts shown in the overview tables on this tab are already converted into Euro. A partner organisation with expenditures in another currency than Euro has to be aware that exchange rates are updated monthly, therefore the values might change in draft reports (compared to previous month) at the begin of a new month (see also Partner report List of expenditures).
Previously reported columns are displaying separately in a second row how much of the total was previously parked by control.
Current report columns are displaying separately in a second row how much of the total is amounts that were previously parked by control and partner decided to reinclude in current partner report.
A column with Total eligible after control that sums up total eligible certified by control shows up in partner report overviews once control work is finalized.
Partner Expenditure - summary (in Euro)
This section shows the partner budget - approved in application form, previously reported, current report, previously validated, previously paid - divided per fund and contribution type (public/private/automatic public) - at the moment of creation of current partner report, and also shows some calculations using figures from the table.
For contribution type, as the information bubble explains, the split per partner contribution is calculated horizontally, using the figures from the table and from Application form, namely “AF amount of contribution” / “AF partner eligible budget“ * “Total current report“, rounded down to whole cents.
Previously reported column: Sums up amounts from partner reports previously submitted (including reopened ones), but also partner’s share in the fast track lump sums confirmed by the programme (see Contract monitoring section for details). Amounts that were previously parked by control are displayed in second row in this column.
Remaining budget: This column indicates the difference between Total reported so far and Partner total eligible from the application form. This value can become negative in case the reported expenditures exceed the budget in approved AF.
Previously validated: indicates sum of Total eligible after control from certified partner reports and fast track lump sums confirmed by programme (see Contract monitoring section for details).
Previously paid column: When a (regular or fast track lump sum) payment is made, the amounts related to funds paid by the programme will be added to this column, in the next created report after payment is confirmed in the system. For further details on payments please see Payments to projects .

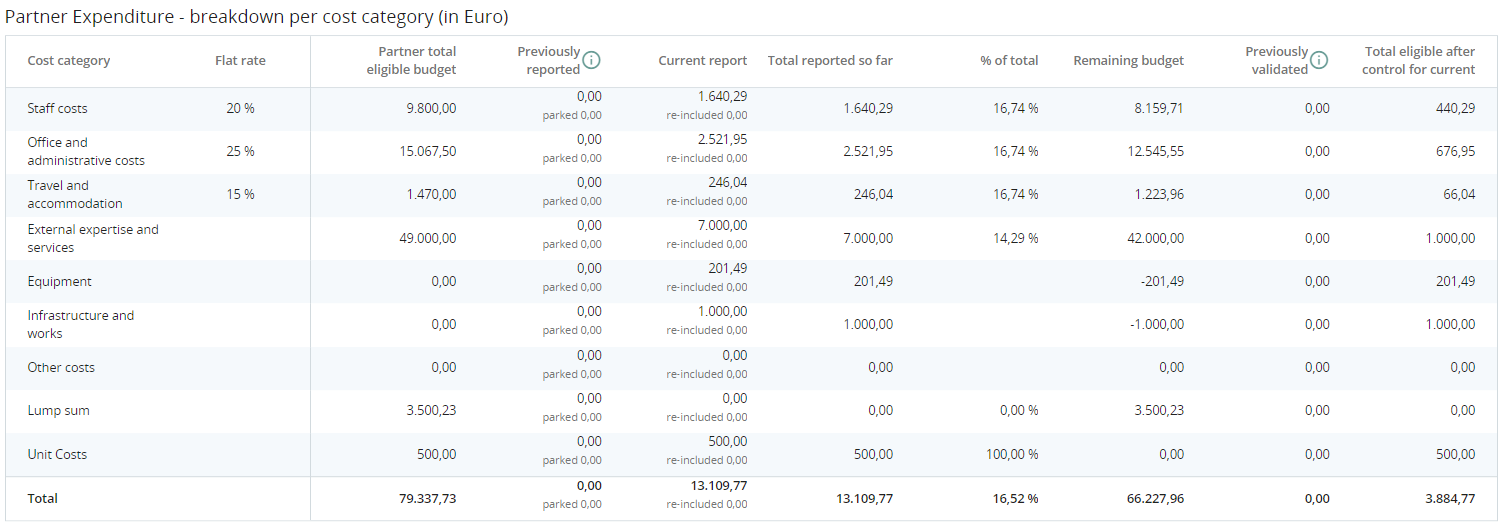
Partner Expenditure - breakdown per cost category (in Euro)
This table shows the partner budget - approved in application form, previously reported and current report - split per cost category. The table behaves quite similar as the other tables with similar columns. There are however a few unique elements that are important to note in regard to the Simplified Cost Options:
Flat rates: In contrary to eMS, the flat rate is only calculated in the overview table on the totals declared in the current report. Therefore, there is less rounding difference in relation to flat rates, as they are calculated on top of total sums and not on top of each individual cost item, directly in the list of expenditure.
Lump sums & unit costs covering multiple cost categories: always show up in their own separate row and are never added up in specific cost categories. Flat rates are not calculated on top of the Lump sums or unit costs covering more than one cost category.
Unit costs covering single cost categories: Are added to the cost category they belong to, next to other normal cost items for the respective cost category. Flat rates are calculated on top of these unit costs.

Partner Expenditure - breakdown per Lump sum (in Euro)
This table shows the Lump sums and their partner share. Lump sums declared in the list of expenditure show up in the Current report column.
Fast track lump sums, if used in the project, are displayed in Previously reported column. Therefore, at the end, this table shows which lump sums are approved in Application Form and which are already reported.

This table is hidden when no lump sums are used in the project.
Partner Expenditure - breakdown per Unit cost (in Euro)
Similar as the lump sum overview table, this table lists all unit costs approved in Application and reported by the partner.

This table is hidden when no unit costs are used by this partner.
Partner Expenditure - breakdown per investment (in Euro)
In this overview table all cost items linked to an investment are summed up.
What is important to note is what is described in the info bubble: no Simplified cost items are added up to this table, as they are automatically calculated on top. Only real costs linked to the investment in the List of expenditure are displayed in this overview table.

This table is hidden when no investments are used in this project.
