Financial living tables
Similar as the indicator living tables the financial living table aggregate data from Application Form and from reporting including payment.
For all the living tables below whenever any of the following actions take place these tables will most likely change in the respective column:
A project modification
Submission of a new partner report
Certifying a partner report
Submission of a project report
Finish verification of a project report
Payment based on financial project reports
Setting FTLS to ready for payment and paying them.
Reopening or reverting any of the above mentioned actions
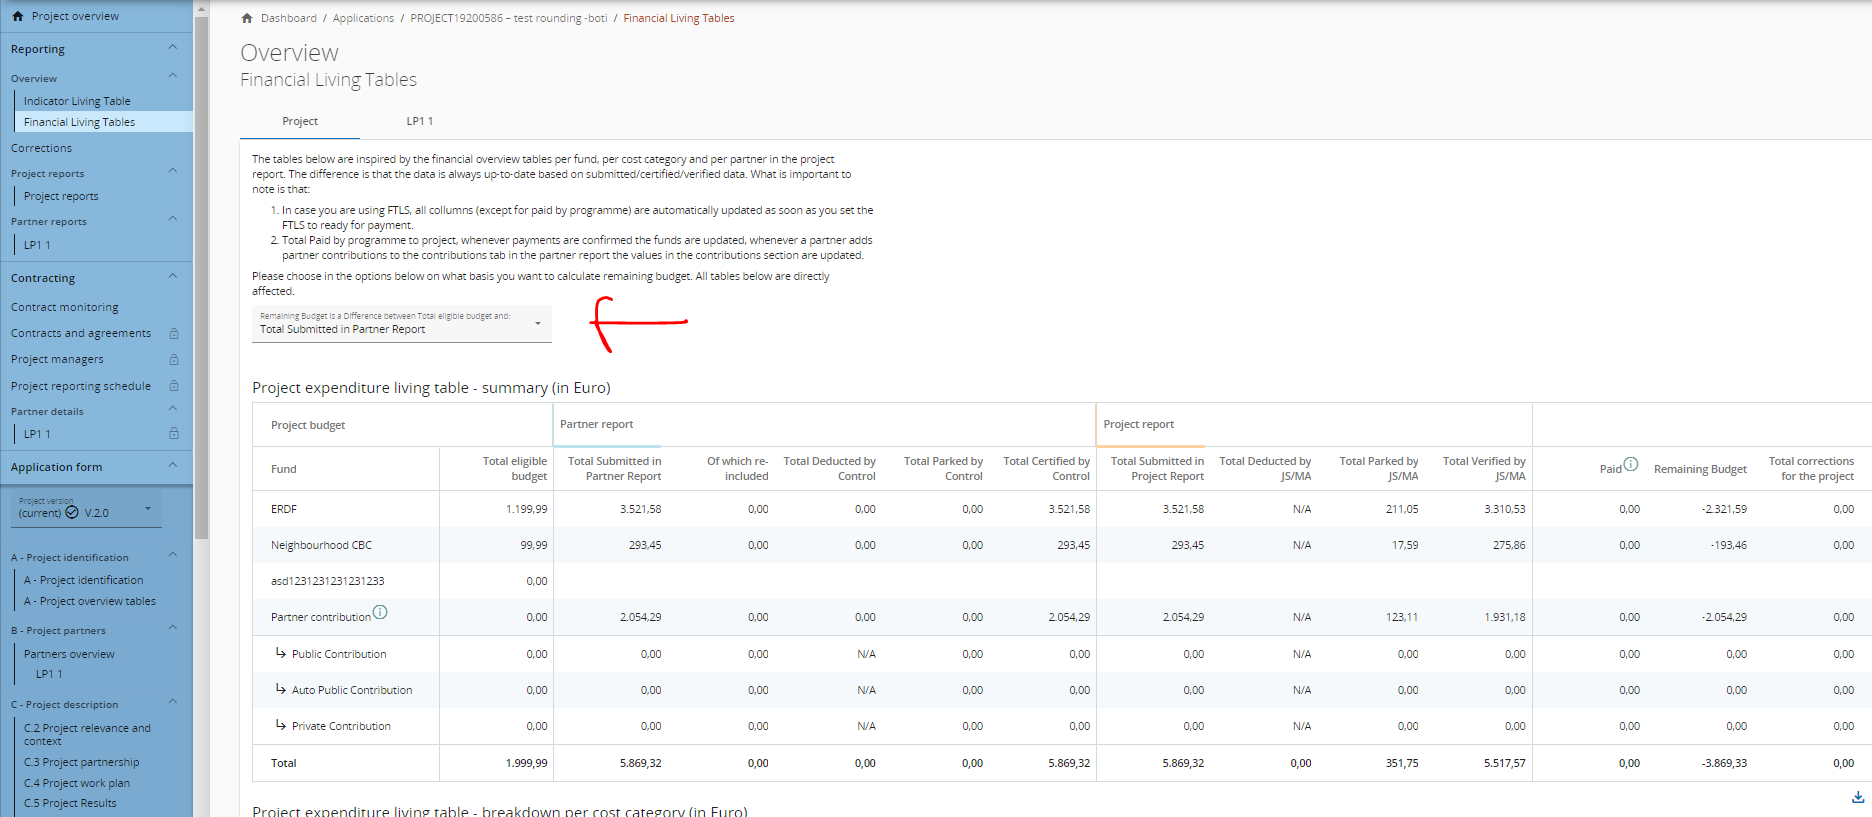
The column Remaining budget is flexible: In the dropdown above the living tables users can choose if the Remaining budget is Application form budget minus Submitted in partner report, Certified, Submitted in project report, Verified or Paid amounts.

Project financial living tables
The project financial living tables are basically the first 3 Financial overview tables in any finance or full project report but here always up to date.
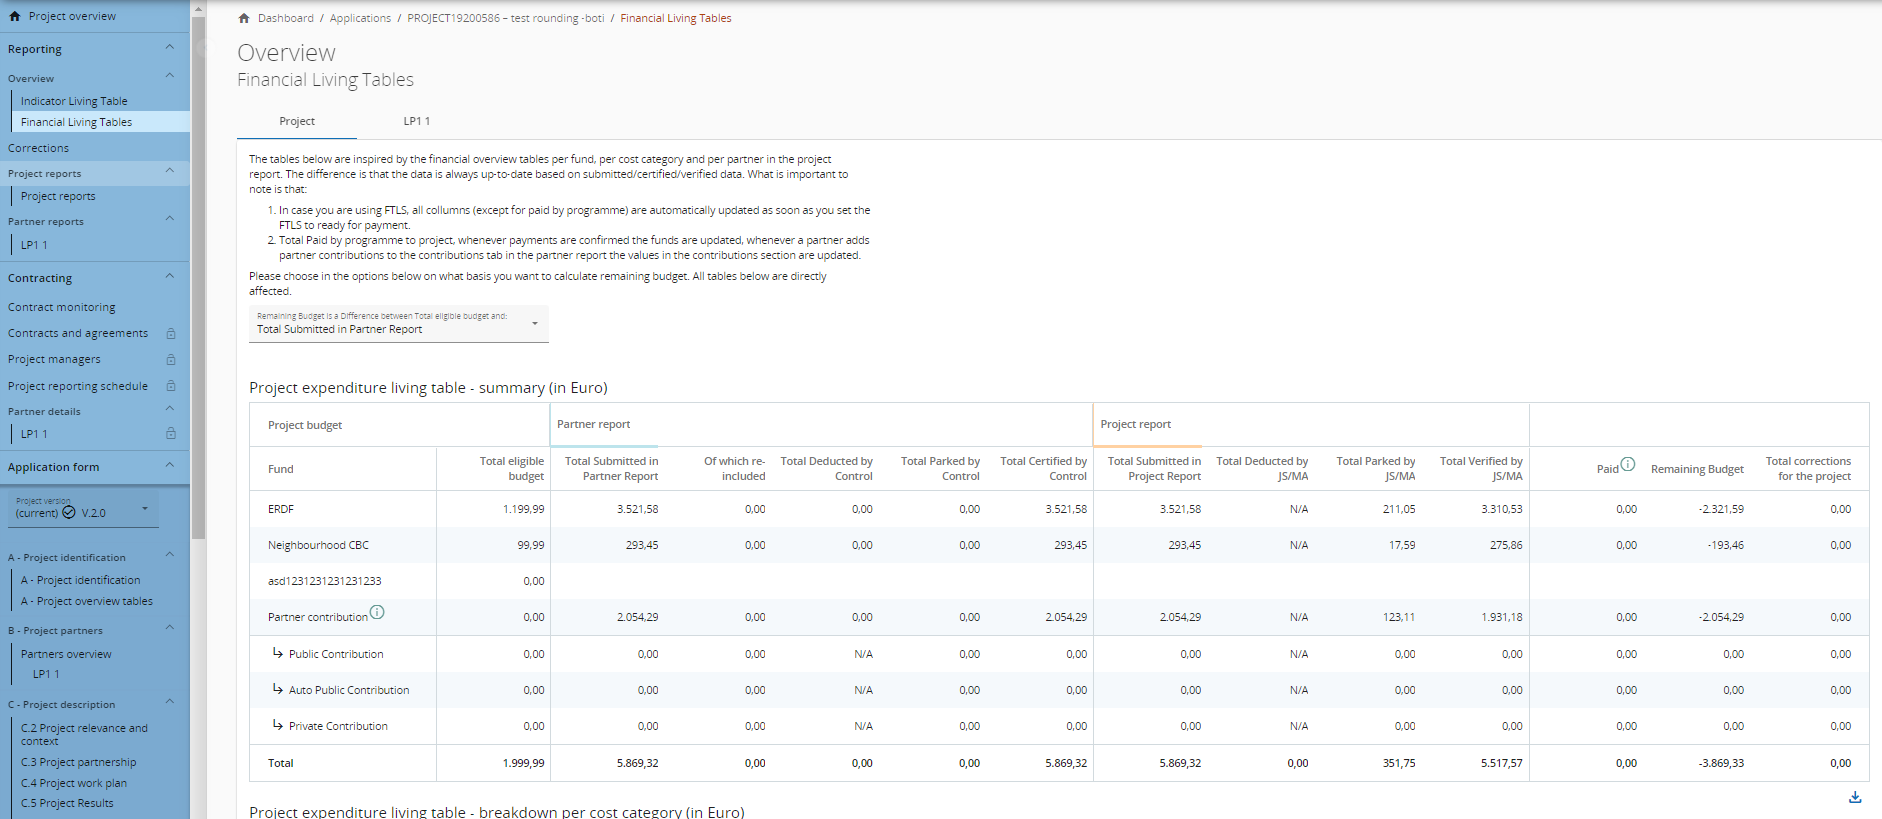
Project expenditure living table - summary (in Euro)
The first table is an overview per fund. The financial spending per fund and contribution is recorded here. Some values like the contribution share of deductions cannot be retrieved from the reports therefore you might sometimes see some values as N/A.

Paid, as explained in the info bubble is represented slightly different than one might expect. Since funds are only paid in Jems the Fund part comes from the payment section and is paid by the programme. The contributions come from the partner report contribution follow-up. This column reflects both partners’s own contributions as well as contributions from external sources.
Project expenditure living table - breakdown per cost category (in Euro)
This table represents the breakdown per cost category, as a principle the columns are the same as the first table and the totals should always match with the totals from the other tables. The only difference is that the amounts are split per cost category instead of per fund as in the first table.

Project expenditure living table - breakdown per partner (in Euro)
Similar as to the 1st and the second table this table should have the same totals per column as the columns are the same for all tables. The difference is that in this table the spending is split per partner. Every row represents a partner and their total spending.

SPF: In case of SPF projects, the breakdown per partner table is hidden as there is only one partner and a breakdown per partner would not add further value (SPF have only 1 beneficiary).
Partner financial living tables
The partner financial living tables are split into a tab per partner.
SPF: In case of SPF projects, the partner financial living tables only show management budget and management costs reported in the Partner report and do not include the SPF budget and costs.
In case a programme wants to provide specific guidance for SPF projects in the explanation text of the Financial Living Tables, this can be done by using Call translations.
Depending on privileges you might see or not see certain partners (e.g. in the case of a controller being assigned to one partner).
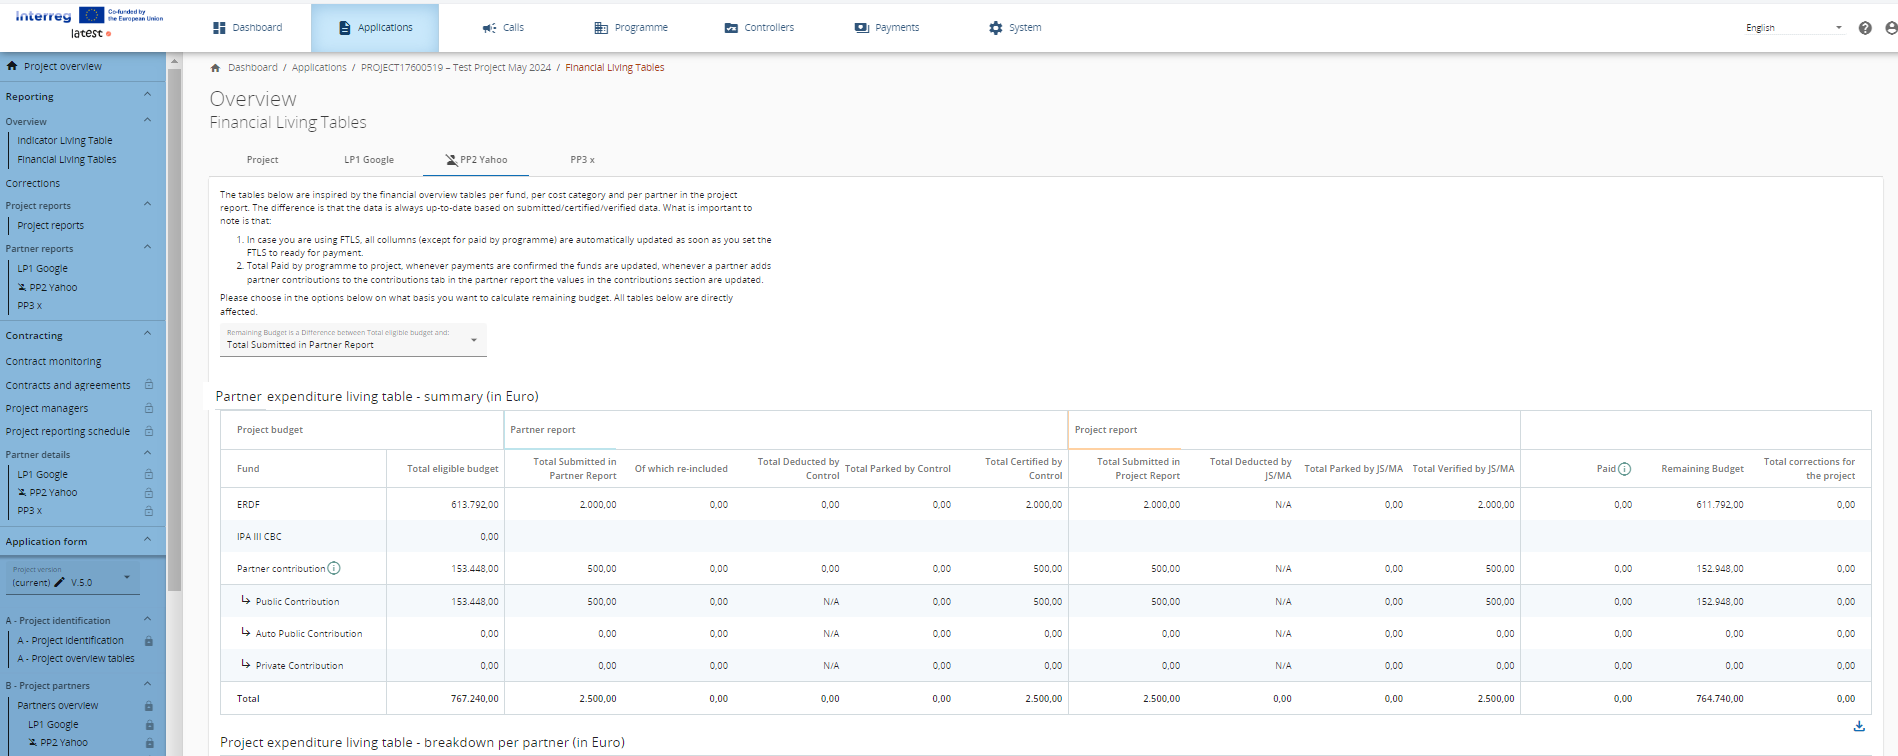
Partner expenditure living table - summary (in Euro)
On a tab of a partner you will find two tables. The first table is the spending of the partner per fund. Also here some of the deducted rows could not be populated and are therefore pre-filled with N/A. Totals should always be the same as a single row of the third project living table being the spending per partner at project level. In the same way as the first project financial living table, Paid represents the total paid for the partner and the contributions recorded as received in the partner report by the respective partner.

Partner expenditure living table - breakdown per cost category (in Euro)
The second table at partner level is the breakdown per cost category (in Euro). This table should always have the same totals as the first table as the columns are the same. The only difference is that the amounts are divided per cost category instead of per fund.

